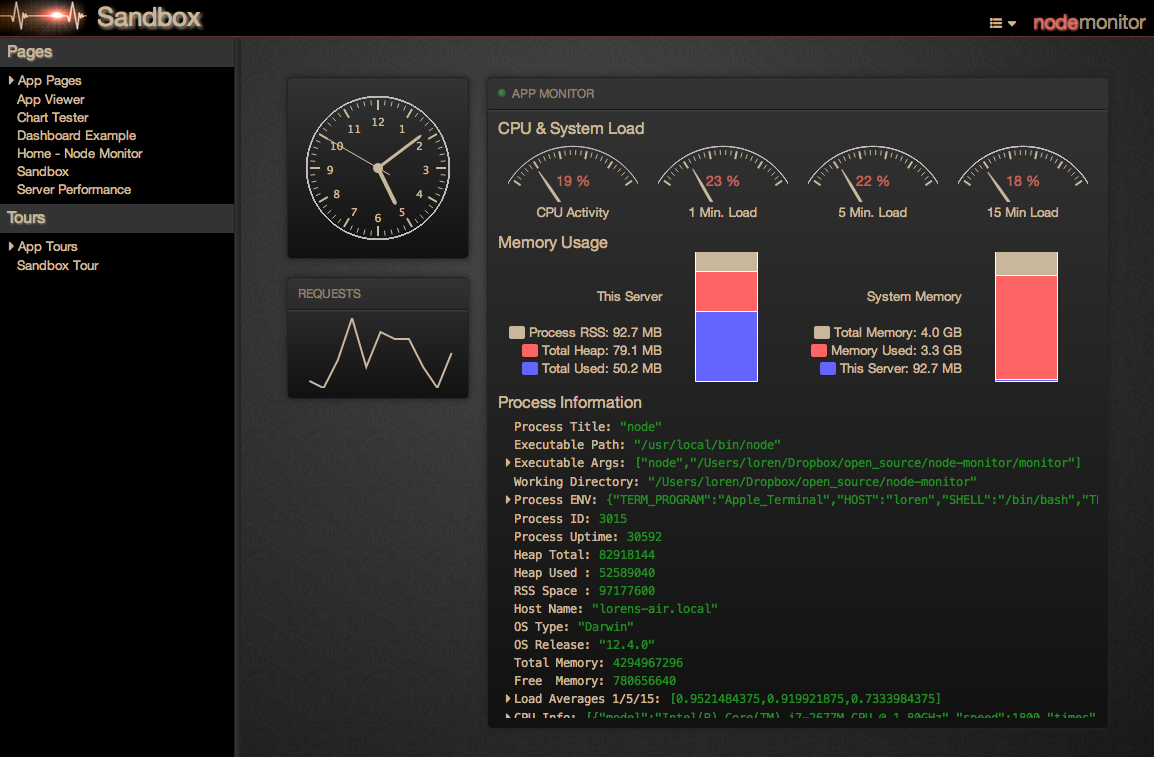
 Monitor Dashboard
Dashboards
Each page in the site is a dashboard. You can have as many dashboards as you like, and you can create a dashboard hierarchy with the path to your pages.
To create a new dashboard, enter a new page URL in your browser. Like a Wiki, if the page doesn't exist, monitor dashboard asks if you want to create one at that URL.
Header
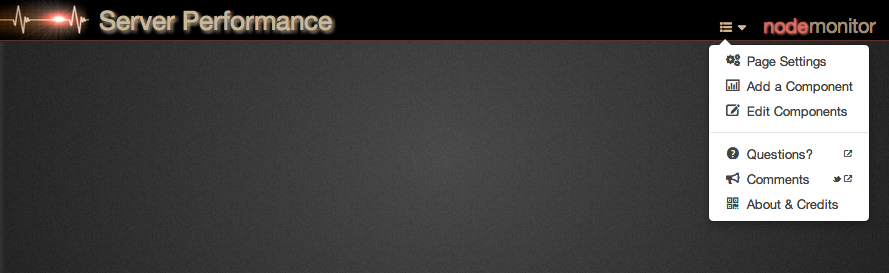
The header contains the page title and main menu. Hovering over the title displays the page description (if one is set), and clicking the title takes you to the page settings dialog.
The drop-down menu lets you manage various elements within the page, and the About section gives kudos to the software used to build monitor dashboard.
Clicking the logo on the right opens and closes the header bar.
Sidebar
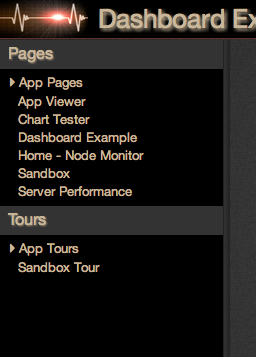
The dashboard pages in your site are displayed in the sidebar for single-click navigation. The sidebar is updated as pages are added, and a page hierarchy is maintained based on the URL path to the page.
Page tours are also shown in the sidebar, and can be run by selecting the tour. For more on tours, head over to the tours overview page.
The sidebar can be resized by dragging the divider, and clicking the divider quickly opens and closes the sidebar. Like opening and closing the header, this can be handy for full screen monitors.
New pages and tours can be added by hovering over the Pages and Tours title bar, and selecting the icon to the right.
Components
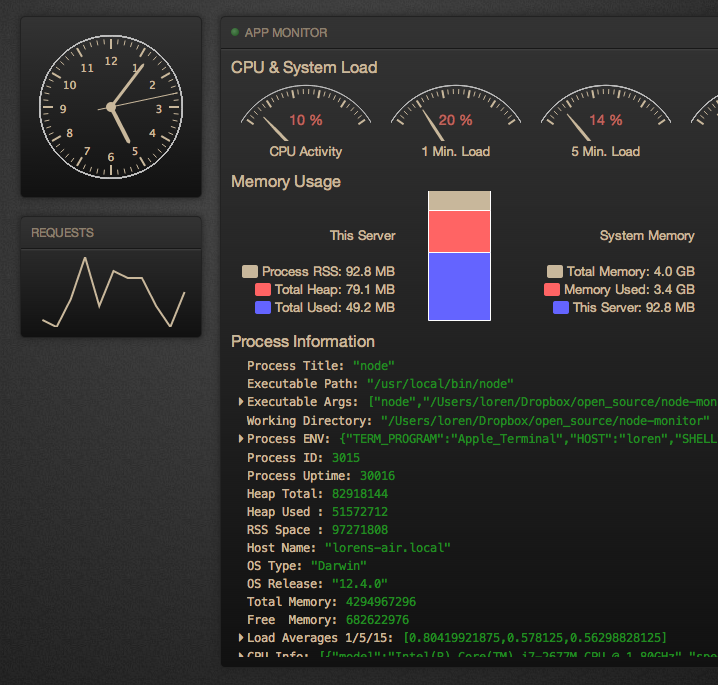
Components are the items contained on a dashboard page. They are added by selecting "Add a Component" on the drop down menu, and they can be sized and positioned anywhere on the canvas.
Clicking on the component title opens a settings screen to customize the component. Changes are seen immediately, but aren't persisted to the page until the 'Save' button is pressed. A "view source" button is available giving you access to the underlying structure of that component.
A core set of components from the core-monitor project are bundled with monitor dashboard, and other component types can be written and packaged as monitor apps.
Core Components
The following components are installed by default from the core-monitor project.
App ViewerAn application process viewer |
|
Bar ChartA Highcharts bar chart |
|
ButtonA button to place on a page that runs javascript when pressed |
|
ClockA clock can put a finishing touch on a dashboard |
|
GaugeA fuel gauge for expressing the current state |
|
HTML TemplatePlace any HTML on your dashboard, optionally merging backend data with text. |
|
Line ChartA highcharts line chart |
|
Log ViewerA highly configurable log viewer, with a filtering and JSON expansion. |
|
Object InspectorMonitor any globally available object. If the object is a backbone model, monitor changes in real time. |
|
Pie ChartA Highcharts pie chart |
|
Probe ViewerMonitor any probe running in any of your Node.js processes. |
|
REPL ConsoleYeah. In a browser. |
|
SliderShow the state of a numeric variable, and allow user input. |
|
Spark LineA Highcharts line chart, without the dressing. |
|
Web SnippetEmbed a snippet of another web page in your dashboard. |