 Monitor Dashboard
Getting Started
Introduction
Monitor dashboard is an open source Node.js webapp for monitoring Node.js applications. It hosts components assembled onto dashboards you create for visualizing and controlling your systems in real time.
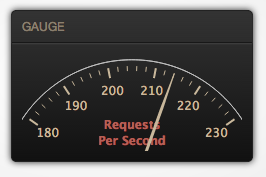
It has built-in components for monitoring process information, application logs events, business stats, and objects running within a Node.js process. A REPL console lets you log in and inspect your app servers from your desktop.
Designed for extentsion, monitor dashboard allows you to write custom visualizations for your application. Module developers can write and publish add-ons for monitoring and controlling your modules.
Dashboards
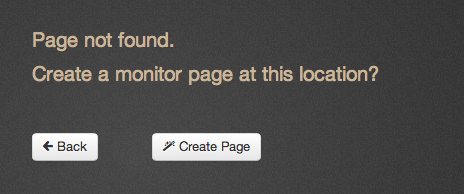
Each page in the site is a dashboard. You can have as many dashboards as you like, and you can group them by URL path. To create a new dashboard, enter a site URL in your browser. If the page doesn't exist, monitor dashboard asks if you want to create one at that URL.
Try it: localhost:4200/testing/gettingStarted
For more on dashboards, head over to the dashboard overview page.
Tours
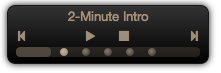 Select a tour in the sidebar for a guided page tour through some interesting pages on the site.
The tour control appears at the bottom of the screen, where you can pause, play, stop, advance, rewind, or navigate directly to a page. Hovering over the icons while the tour is running provides more information.
Tours can be created for any group of pages in your site. They can also come bundled with your favorite Node.js apps.
For more on tours, head over to the tour overview page.
Apps
Monitor dashboard can be extended to monitor anything accessable from a running Node.js process.
Are you the publisher of an npm.org module? Head over to the app overview page for more on building monitors and runtime controls for your module.